
The painful truth is that you aren’t losing to algorithms because they are faster; you are losing because you are predictable.
- Institutional bots don’t just react to the market; they actively engineer volatility to trigger stop-loss clusters and manufacture liquidity.
- Surviving requires shifting from a reactive mindset to a proactive one, learning to identify the specific algorithmic footprints left on the order book.
Recommendation: Stop placing stop-losses based on arbitrary technical levels and start placing them based on points of thesis invalidation—the price at which your original reason for entering the trade is proven fundamentally wrong.
If you’ve ever watched a position move in your favor, only to be stopped out by a sudden, violent price wick that immediately reverses, you are not alone. It’s not bad luck, and it’s not a random market fluctuation. It is the calculated result of an automated hunt. The retail trading world is flooded with generic advice: « use tight stops, » « trade the trend, » « manage your emotions. » Yet, traders following this advice are consistently harvested by a superior predator: the institutional high-frequency trading (HFT) bot.
These algorithms operate in a different reality, measuring time in nanoseconds and making decisions devoid of human bias. They don’t just participate in the market; they create the weather. They see the clusters of retail stop-loss orders on the book as a pool of guaranteed liquidity to be taken. To believe you can out-trade them on speed or intuition is a fatal misconception. The constant cycle of small wins erased by sudden, inexplicable losses is the direct result of playing a game where the rules are written by your opponent.
But what if the key to survival isn’t to be faster, but to be smarter? What if, instead of being the prey, you could learn to think like the predator? These bots, for all their complexity, are slaves to their programming. They leave footprints. They follow predictable patterns to stalk and trap their targets. This guide is not another collection of tired trading platitudes. It is an insider’s look into the algorithmic kill-chain, designed to expose the mechanics of the hunt and arm you with the defensive strategies needed to navigate a market architected for your failure.
We will dissect the mathematical certainty of retail losses against bots, expose their manipulative tactics, and provide a concrete, rule-based framework for survival. By understanding the machine, you can finally stop being its fuel.
Summary: A Retail Trader’s Field Guide to Algorithmic Markets
- Why Manual Retail Traders Are Mathematically Guaranteed to Lose Against Algorithmic Bots?
- How to Spot Algorithmic Order Book Spoofing Before You Commit Your Capital?
- Market Making vs Arbitrage Bots: Which Algorithmic Force Drives Flash Crashes?
- The Stop-Loss Placement Error That Makes You Perfect Prey for High-Frequency Bots
- When Must You Completely Stop Manual Trading During Algorithmic Flash Events?
- Why Emotional Human Trading Consistently Underperforms Simple Algorithmic Rule Sets?
- When to Deploy Your Cash Reserves During a Severe Stock Market Crash?
- How to Use Retail Algorithmic Tools to Generate Genuine Alpha on UK Stocks?
Why Manual Retail Traders Are Mathematically Guaranteed to Lose Against Algorithmic Bots?
The playing field is not level; it is tilted at a ninety-degree angle. Manual retail traders operate with fundamental disadvantages that make consistent profitability against algorithmic systems a mathematical improbability. The first and most obvious is speed. HFT firms co-locate their servers within the same data centers as exchange matching engines, reducing latency to nanoseconds. Your click is a snail crossing a highway against their light-speed execution. But the true disparity runs far deeper than just latency.
Algorithmic systems have an information advantage that is absolute. They process market data, news feeds, and order book flow across dozens of venues simultaneously. While you analyze a chart on a single screen, a bot has already cross-referenced micro-second price discrepancies, order imbalances, and macroeconomic data releases to front-run the market’s next move. This isn’t just a faster reaction; it’s a form of precognition based on superior data processing. They are not guessing where the market is going; they are calculating its most probable path based on the actions of every other participant, especially predictable retail traders.
The scale of their operation is staggering. Market analysis shows that approximately 60% of equity trades in the U.S. involve high-frequency trading, making them the dominant force shaping price action. The outcome of this mismatch is brutally clear. Further analysis of 8 million traders shows that 74-89% lose money during every major volatility event. This isn’t a failure of discipline; it’s the inevitable outcome of a structural imbalance. You are a single soldier with a rifle fighting a fleet of automated drones. Winning isn’t a matter of courage; it’s a matter of changing the rules of engagement.
How to Spot Algorithmic Order Book Spoofing Before You Commit Your Capital?
One of the most predatory tactics used by institutional bots is « spoofing. » This is not just aggressive trading; it is a form of market manipulation, and it is illegal. Spoofing involves placing large, visible orders on the order book with no intention of executing them. The goal is to create a false impression of supply or demand, tricking other market participants—primarily retail traders—into buying or selling into the spoofer’s true position. They might flash a massive buy wall to induce panic selling, only to pull the order and buy the dip they just created.
These algorithmic footprints are visible if you know what to look for. It requires moving your focus from the price chart to the market depth and order book data. The bot’s intention is to create an emotional reaction, but its actions are purely mechanical and leave a trail of evidence. By analyzing the behavior of large orders, you can begin to distinguish genuine market interest from manufactured pressure.
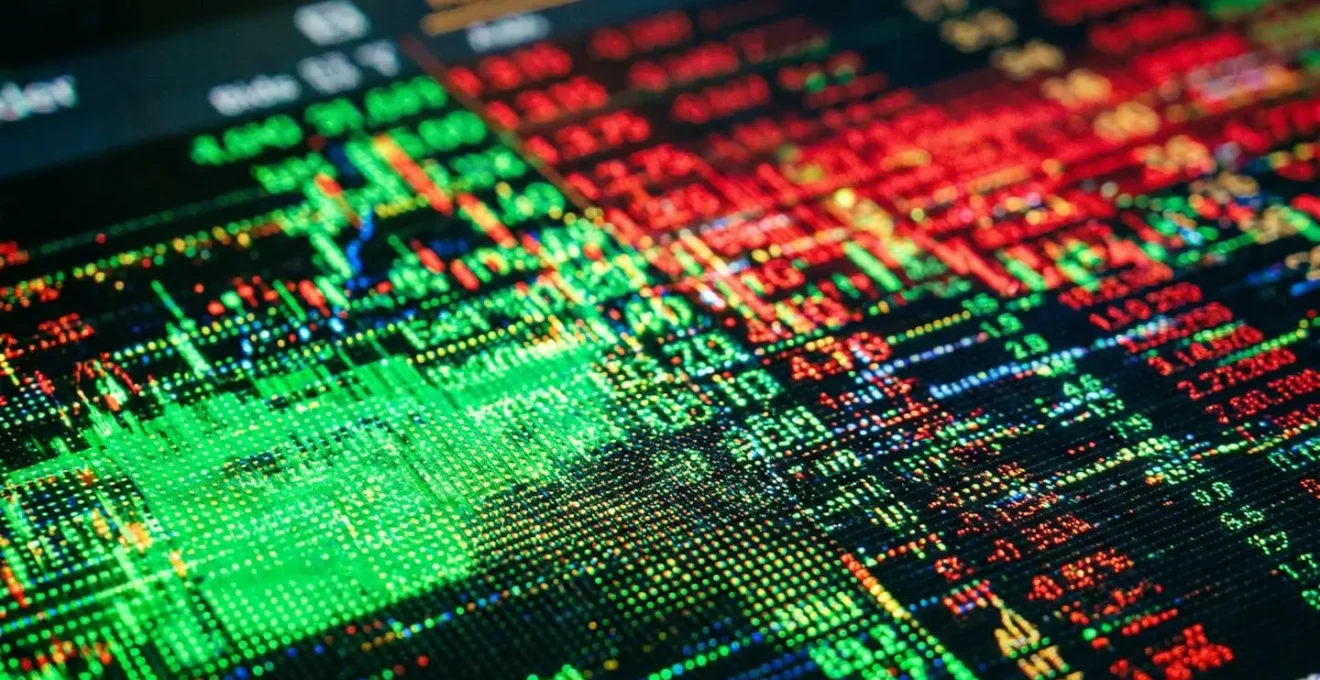
The visualization above abstracts the core concept: spoofing bots rapidly place and cancel orders, creating a flickering, unstable depth chart designed to manipulate perception. A genuine order book has a certain weight and stability; a spoofed book feels hollow and erratic. The key is to watch for large orders that appear and disappear without ever being filled, especially around key psychological price levels. These are not real participants; they are mirages designed to lure you into a trap.
Checklist: Spotting Algorithmic Spoofing in Real-Time
- Monitor for Asymmetrical Order Placement: Check if large orders appear exclusively on one side of the book. Spoofers typically concentrate pressure on a single side to drive price in the opposite direction where they want to execute.
- Track Order Flow vs. Trade Direction: Analyze whether actual trades are occurring in the same direction as the heavy order book. Genuine spoofing often involves showing large bids while the manipulator is actually selling, or vice versa.
- Analyze Order-to-Transaction Size Discrepancy: Look for large resting orders that are many multiples of the average transaction size. If a 100,000-share order appears in a market where the average trade is 200 shares, it’s a red flag for non-genuine intent.
- Watch for « Flash and Pull » Patterns: Identify large orders that are removed a microsecond after opposite-side trades execute. This indicates the order was only there to induce a reaction and was never intended to be filled.
- Identify « Magnet » Orders at Key Levels: Pay close attention to large orders that sit near the best bid/ask but never trade, especially at obvious support or resistance. Their purpose is psychological, to pin the price or trigger breakouts/breakdowns.
Market Making vs Arbitrage Bots: Which Algorithmic Force Drives Flash Crashes?
Not all bots are created equal, nor are their intentions the same. Understanding the two dominant species of HFT algorithms—Market Makers and Arbitrage Bots—is crucial to comprehending how markets can suddenly and catastrophically collapse. One provides liquidity, the other consumes it, and their interaction in a crisis is what fuels a flash crash.
Market-Making Bots are the designated liquidity providers. Their job is to constantly quote a bid and an ask price, creating a stable market and profiting from the spread. Under normal conditions, they are a stabilizing force. However, their programming includes a critical self-preservation rule: when volatility spikes beyond a certain threshold, they are programmed to pull their orders and widen their spreads to avoid taking on excessive risk. In a moment of stress, they vanish, creating a liquidity vacuum.
This is when Arbitrage Bots take center stage. These algorithms are designed to exploit tiny price discrepancies between different exchanges or related assets. When market-making bots flee, a selling cascade can begin on one exchange. The arbitrage bots see the price drop and, following their programming, instantly sell the same asset on other exchanges to capture the difference. This transmits the panic from one venue to all others, creating a self-reinforcing death spiral. It’s not a single entity causing the crash; it’s a systemic failure where the providers of stability disappear, and the exploiters of inefficiency pour gasoline on the fire.
Case Study: The 2010 Flash Crash
On May 6, 2010, the Dow Jones Industrial Average plunged nearly 9% in minutes, erasing almost $1 trillion in value before recovering. The event was triggered when a single large institutional seller used an algorithm to sell $4.1 billion of E-Mini S&P contracts. HFT market makers initially absorbed this, but as the sell pressure continued, their risk limits were hit, and they withdrew liquidity. This vacuum caused a « hot-potato » effect, where HFTs rapidly passed contracts among themselves. A SEC investigation revealed that within a 14-second window, HFTs accounted for 49% of total trading volume while providing almost no net liquidity. The absence of buyers triggered arbitrage bots to chase the falling prices across global markets, creating a full-blown cascade until exchange circuit breakers halted trading. This event perfectly illustrates how the interaction between different algorithmic strategies, not a single rogue bot, creates systemic risk.
The Stop-Loss Placement Error That Makes You Perfect Prey for High-Frequency Bots
For retail traders, the stop-loss order is taught as the ultimate risk management tool. In reality, the way most traders use it turns it into a beacon for predatory algorithms. The fundamental error is placing stops at obvious technical levels. When you place a stop-loss just below a 50-day moving average, a round number, or a well-known pivot point, you are not being clever; you are joining a herd. HFT algorithms are specifically designed to detect these stop-loss clusters.
To a bot, this cluster of orders represents a massive, predictable, and one-sided pool of liquidity. If a bot needs to buy a large position, it knows that just below that key support level sits a huge volume of guaranteed sell orders (the stop-losses). It becomes profitable for the algorithm to briefly push the price down, trigger that cascade of stops, absorb all the sell orders to fill its position at a favorable price, and then let the market snap back. This is « stop-loss hunting, » and it’s not a conspiracy theory; it is a core profit strategy built on exploiting predictable human behavior.
The solution is to stop thinking about price and start thinking about your thesis. A stop-loss should not be placed at a level where you « hope » the price won’t go. It should be placed at the price that definitively proves your trading hypothesis wrong. This is a subtle but profound shift. It forces you to define your entry reason with absolute clarity. If you bought because of a breakout above a resistance level, your stop shouldn’t be a random 1% below; it should be at the level that invalidates the breakout, turning it into a failed move. This moves your stop away from the herd and places it at a point of logical, not emotional, significance.
- Place stops based on thesis invalidation: Determine the price that proves your trade idea wrong, not just a convenient technical level.
- Avoid obvious stop clusters: Use tools like Average True Range (ATR) multiples to place stops at less predictable distances from key levels that bots systematically target.
- Utilize order obfuscation: If your platform allows, use TWAP (Time-Weighted Average Price) or VWAP (Volume-Weighted Average Price) execution to build your position over time, hiding your full size from the order book.
- Consider mental or server-side stops: Instead of resting stop orders visible to everyone, use alerts or broker-contingent orders that are not displayed on the public order book, making you an invisible target.
- Use structural levels for wider stops: For longer-term trades, place stops at major structural points (e.g., weekly swing lows) rather than tight intraday levels that are easily triggered by algorithmic noise.
When Must You Completely Stop Manual Trading During Algorithmic Flash Events?
There are times when the only winning move is not to play. During an active algorithmic flash event, the market ceases to be a place of price discovery and becomes a chaotic vortex of cascading liquidations. Human decision-making is not just disadvantaged in this environment; it’s a liability. Your emotional responses and slow reaction time will be ruthlessly exploited. The key is to recognize the early warning signs of a liquidity collapse and have a pre-defined, non-negotiable set of rules to halt all activity.
The first sign is a catastrophic evaporation of liquidity. As we saw in the 2010 Flash Crash, when market makers pull their bids and offers, the order book becomes dangerously thin. Data from that event showed that in the span of minutes, buy-side depth fell to about 25% of its mid-day value while sell-side depth collapsed to just 15%. This is visible in real-time as a dramatic widening of the bid-ask spread. When the spread on a liquid stock blows out to 200-300% of its normal range, it is a fire alarm signaling that the market’s structural integrity has failed. Any market order you place in this environment will be filled at a disastrous price.
Continuing to trade manually during these events is financial suicide. You are pitted against algorithms triggering each other in a feedback loop that has detached from any fundamental reality. This is not a « dip » to be bought. It is a structural failure. The professional response is to step away and wait for the system to reboot. This requires having your own « personal circuit breakers » based on quantitative data, not gut feeling. When these triggers are hit, all trading must cease. No exceptions.
Your Personal Circuit Breaker Checklist: When to Halt Trading
- Assess the Bid-Ask Spread: Halt all trading immediately when the bid-ask spread widens by more than 200-300% from its typical range for that asset. This signals that market makers have fled.
- Monitor Order Book Depth: Cease trading when the cumulative depth at the first five price levels drops below 30% of the average seen over the previous hour. This indicates extreme liquidity stress.
- Observe Cross-Asset Contagion: Stop trading your primary asset when highly correlated markets experience flash events (e.g., halt individual stock trading if the VIX spikes over 50% in minutes or a major index like the S&P 500 hits an exchange-level circuit breaker).
- Distinguish the Event Phase: Identify the « Ignition Phase » (cascading price with vanishing liquidity) and stop all activity. Do not attempt to trade until an « Exhaustion Phase » is confirmed (a climactic volume spike followed by a sharp V-shaped price reversal).
- Enforce Portfolio-Level Drawdown Rules: Automatically halt all trading for the session when your total account drawdown exceeds a pre-set limit (e.g., 3-5%). This prevents emotional « revenge trading » that exponentially compounds losses during a crisis.
Why Emotional Human Trading Consistently Underperforms Simple Algorithmic Rule Sets?
The ultimate advantage an algorithm has over a human is not its speed, but its soullessness. A bot does not feel fear when a position goes against it. It does not feel greed after a winning streak. It does not feel the need for « revenge » after a loss. It simply executes its pre-programmed rules with perfect, robotic consistency. Humans, on the other hand, are hardwired for self-sabotage in a trading environment.
Trading triggers a potent cocktail of cognitive biases. The Disposition Effect makes us sell winners too early to lock in a small dopamine hit of profit, while we let losers run in the irrational hope they will come back, avoiding the pain of admitting a mistake. Confirmation Bias causes us to seek out information that validates our existing position and ignore evidence that contradicts it. After a string of losses, a trader is highly susceptible to « revenge trading »—taking oversized, high-risk positions in a desperate attempt to make back the money, completely abandoning their strategy.

This emotional spiral is not just a theory; it is a quantifiable pattern of failure. In-depth research analyzing 295 million trades reveals that 85% of failed retail accounts followed the identical four-phase spiral of overconfidence, self-sabotage, fatigue, and poor timing. The human mind is simply not built to make rational, probabilistic decisions under the immense pressure and constant feedback loop of the market. Every tick against you is a small psychological blow, and every tick in your favor is a temptation to deviate from the plan.
Trading exposes individuals to a potent mix of dopamine, ego, and stress. This combination results in emotional self-sabotage, overconfidence, revenge trading, fatigue, and poor timing repeat with clockwork precision.
– Saad Naja, Founder & CEO of PiP World, Study of 8 million retail traders
When to Deploy Your Cash Reserves During a Severe Stock Market Crash?
In the midst of a market crash, fear is palpable and cash feels like the only safe haven. The amateur impulse is to either panic sell at the bottom or try to « catch a falling knife » too early. The professional approach, however, is to wait for specific, quantifiable signals that the HFT-driven panic has exhausted itself and institutions are beginning to accumulate. Deploying cash is not about timing the exact bottom; it’s about entering when the risk/reward has structurally shifted in your favor.
The most critical signal is the capitulation signature. This is an event characterized by an astronomically high volume spike—often 3 to 5 times the daily average—combined with a sharp, V-shaped reversal in price. This indicates that the last of the panicked retail sellers have been flushed out and large institutions are now absorbing the supply aggressively. Buying before this climactic event is trying to stop a freight train. Buying after it is stepping onto the train as it begins to leave the station.
Another prerequisite is volatility contraction. Maximum fear occurs at maximum volatility, which is precisely the wrong time to deploy capital. Instead, you must wait for volatility to peak and then begin to recede. A practical way to measure this is with Bollinger Bands. After a period of massive expansion (e.g., bands widening to over 200% of their typical width), a significant narrowing signals that the panic phase has ended and the market is entering a new period of consolidation or recovery. This is the moment of stabilization where deploying cash becomes a calculated risk, not a gamble.
A disciplined, systematic approach to re-entry is paramount:
- Wait for the HFT Capitulation Signature: Deploy only after a climactic volume spike and sharp V-bottom reversal, signaling that the panic selling is over.
- Monitor for Volatility Contraction: Wait for indicators like Bollinger Bands to narrow significantly after extreme expansion, confirming the panic phase has ended.
- Implement Structural Dollar-Cost Averaging: Allocate reserves in tranches based on technical milestones, such as the VIX falling below 40, the S&P 500 reclaiming its 50-day moving average, and the formation of a confirmed higher-low on the weekly chart.
- Track Cross-Market Stabilization: Ensure both equity and credit markets are recovering together. Look for high-yield credit spreads to contract as a sign of returning risk appetite.
- Avoid the Ignition Phase: Never deploy cash during the initial, liquidity-starved phase of a flash crash. Wait for the Exhaustion Phase marked by climactic volume and stabilization.
Key Takeaways
- Your biggest weakness is not your speed, but your predictability. Bots are programmed to exploit common retail behaviors like placing stops at obvious technical levels.
- Surviving requires active defense. Learn to read the order book for signs of manipulation like spoofing and layering before you commit capital.
- In a flash crash, your only job is to survive. Have personal, quantitative circuit breakers that force you to stop trading when liquidity evaporates.
How to Use Retail Algorithmic Tools to Generate Genuine Alpha on UK Stocks?
After understanding the overwhelming advantages of institutional bots, the logical conclusion is not to give up, but to adapt. You cannot beat HFTs at their own game of speed, but you can use accessible algorithmic tools to play a different game entirely—one focused on niches and inefficiencies that are too small for the billion-dollar funds to exploit. The UK stock market, with its diverse segments like the AIM, offers fertile ground for this approach.
The core strategy is to automate the discovery of information and the execution of rule-based trades in less liquid areas of the market. While HFTs dominate the highly liquid FTSE 100, they often ignore smaller-cap stocks on markets like the AIM (Alternative Investment Market). This creates an opportunity for retail-sized algorithms to profit from clear momentum and mean-reversion patterns that are simply not large enough to be worthwhile for a major fund. The rise of the UK high-frequency trading server market has driven substantial market share in 2024, but this activity is concentrated, leaving gaps elsewhere.
Platforms like TradingView (with Pine Script) or ProRealTime allow you to build custom scanners and simple automated strategies without a PhD in computer science. The goal is to systematize an edge. For instance, instead of manually reading news, you can build a simple automated parser (using Python or no-code tools) for the UK’s Regulatory News Service (RNS) to instantly flag high-impact keywords like ‘contract win’ or ‘ahead of expectations’ and react faster than any manual trader could. This is how you start to level the playing field: by using automation to enforce discipline and exploit specific, defined inefficiencies.
- Focus on Market Structure Arbitrage: Target less-covered small-caps on London’s AIM, where HFT presence is lower, creating cleaner patterns for retail algorithms to exploit.
- Automate News Flow Analysis: Build automated parsers for the RNS feed to scan for keywords that signal market-moving events, allowing you to react systematically.
- Track Institutional Moves: Monitor Form TR-1 (major shareholding notifications) via RNS to front-run reactions to institutional buying or selling in mid-cap UK companies.
- Systematize Insider Signal Scanning: Create algorithms to scan for clusters of director buying (insider purchases) in smaller UK stocks—a powerful signal too small for large funds but perfect for retail size.
- Leverage Retail Platforms: Use platforms like TradingView with custom scripts to scan the AIM All-Share index for technical breakouts and liquidity inflection points that institutional desks overlook due to size constraints.
The market is a domain of systems. To succeed, you must stop trading based on emotion and intuition and begin operating with your own robust, rule-based system. Start small, define a specific inefficiency you can test, and let the algorithm execute your strategy with the discipline you can’t. This is the path to generating genuine alpha and, ultimately, to survival.